Showing posts with label september. Show all posts
Showing posts with label september. Show all posts
Saturday, March 28, 2015
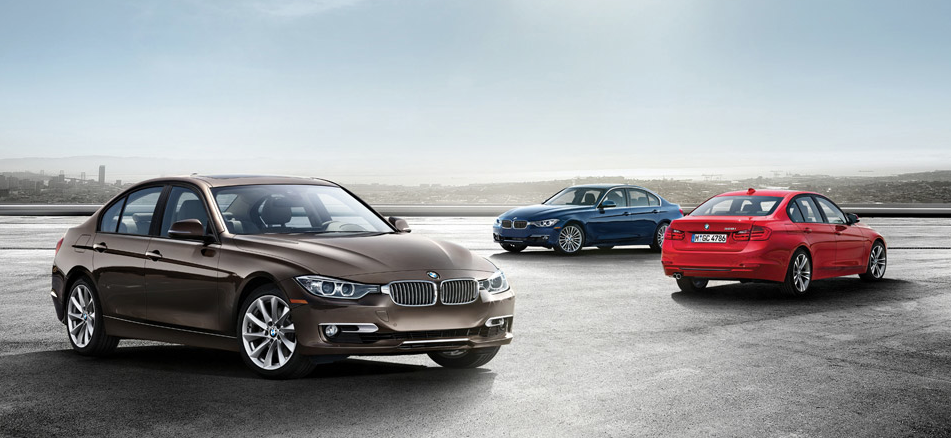
Top 20 Best Selling Cars In America September 2014
• All Makes & Models Ranked By September 2014 YTD U.S. Sales
• U.S. Car Sales Rankings By Model - September 2014 YTD
Accord sales jumped 31% last month; Camry sales slid 11%. The next-best-selling Honda Civic was down 3%. The sixth, seventh, ninth, 17th, 19th, and 20th-best-selling cars in America all reported declining year-over-year sales in September, as well, and this in a market which shot up 9.4% to more than 1.25 million units.
In addition to the Accords big jump, sales of the Chevrolet Cruze, Nissan Sentra, Nissan Versa, Subaru Outback, and Kia Soul all climbed far beyond their September 2013 tallies. Likewise, the BMW 3-Series (sales figures for which include the 4-Series in the U.S.) were half again as strong as they were a year ago. No premium brand car came close to selling as often as the BMW duo, with its wide-spread range encompassing a pair of hatchbacks, a sedan, a coupe, a convertible, and a wagon.
Historical monthly and yearly sales figures for any of these best-selling cars can always be accessed through the dropdown menu at GCBCs Sales Stats page, and for those not viewing the mobile version of this site, near the top right of this page, as well. GoodCarBadCar has already published the list of Americas best-selling trucks and will shortly publish the list of Americas best-selling SUVs in September 2014.
October 2014 • August 2014 • September 2013
Rank | Best-Selling Car | September 2014 | September 2013 | % Change | 2014 YTD | 2013 YTD | % Change |
#1 | Honda Accord | 32,956 | 25,176 | 30.9% | 304,382 | 282,102 | 7.9% |
#2 | Toyota Camry | 28,507 | 31,871 | -10.6% | 334,978 | 318,990 | 5.0% |
#3 | Honda Civic | 22,263 | 22,983 | -3.1% | 253,430 | 253,561 | -0.1% |
#4 | Ford Fusion | 21,693 | 19,972 | 8.6% | 240,585 | 226,293 | 6.3% |
#5 | Nissan Altima | 21,675 | 21,221 | 2.1% | 256,935 | 249,518 | 3.0% |
#6 | Toyota Corolla/Matrix | 20,530 | 23,251 | -11.7% | 258,805 | 233,547 | 10.8% |
#7 | Hyundai Elantra | 18,848 | 19,691 | -4.3% | 176,403 | 194,593 | -9.3% |
#8 | Chevrolet Cruze | 18,415 | 12,730 | 44.7% | 208,114 | 195,775 | 6.3% |
#9 | Ford Focus | 15,397 | 16,733 | -8.0% | 176,156 | 188,654 | -6.6% |
#10 | Chevrolet Malibu | 15,186 | 14,487 | 4.8% | 148,574 | 154,950 | -4.1% |
#11 | Hyundai Sonata | 14,918 | 13,872 | 7.5% | 164,934 | 152,702 | 8.0% |
#12 | BMW 3-Series/4-Series * | 12,814 | 8512 | 50.5% | 94,445 | 77,921 | 21.2% |
#13 | Nissan Sentra | 12,557 | 7798 | 61.0% | 141,216 | 98,281 | 43.7% |
#14 | Nissan Versa | 12,072 | 8776 | 37.6% | 110,272 | 91,535 | 20.5% |
#15 | Subaru Outback ^ | 11,315 | 8143 | 39.0% | 97,266 | 90,073 | 8.0% |
#16 | Chrysler 200 | 10,995 | 9583 | 14.7% | 75,142 | 102,859 | -26.9% |
#17 | Kia Optima | 10,908 | 11,647 | -6.3% | 122,646 | 124,056 | -1.1% |
#18 | Kia Soul | 10,802 | 7416 | 45.7% | 115,579 | 90,624 | 27.5% |
#19 | Volkswagen Jetta | 10,245 | 13,309 | -23.0% | 115,055 | 124,273 | -7.4% |
#20 | Chevrolet Impala | 9225 | 11,462 | -19.5% | 107,162 | 121,033 | -11.5% |
* BMW USA, not GoodCarBadCar, chooses to combined sales of the 3-Series and 4-Series.
^GCBC will be displaying the Outback with cars until at least the end of the year. As an SUV/crossover, it would have ranked 11th in September.
RECOMMENDED READING
Top 20 Best-Selling Cars In America - October 2014
Top 20 Best-Selling Cars In America - August 2014
Top 20 Best-Selling Cars In America - September 2013
U.S. Auto Sales Brand Rankings - September 2014 YTD
Top 13 Best-Selling Trucks In America - September 2014 YTD
Top 20 Best-Selling SUVs In America - September 2014

Wednesday, March 25, 2015
Top 15 Best Selling Luxury Vehicles In Canada September 2014

• Canada Vehicle Sales Rankings By Model - September 2014 YTD
 |
| Click Chart To Expand |
The Audi Q5 is Canadas top-selling premium brand utility vehicle, now 186 units ahead of the second-ranked Lexus RX through nine months. The Q5 has been joined of late by a smaller Q3 in Audi Canadas lineup. Together with the larger Q7, they generated 51% of Audis Canadian volume last month.
Mercedes-Benz is Canadas best-selling premium brand this year, just 50 sales ahead of BMW. Mercedes-Benz Canada sold their first 184 GLAs in September. The GLA is a sister crossover/hatchback to the CLA. 71% of Mercedes-Benzs passenger car volume was generated in September by the entry-level cars: B, C, and CLA. Together with the GLA, they accounted for 44% of Mercedes-Benz volume in this country in September.
Historical monthly and yearly sales figures for any of these top-selling luxury vehicles can always be accessed through the dropdown menu at GCBCs Sales Stats page, and for those not viewing the mobile version of this site, near the top right of this page, as well.
October 2014 • August 2014 • September 2013
Rank | Premium Brand Vehicle | September 2014 | September 2013 | % Change | 2014 YTD | 2013 YTD | % Change |
#1 | BMW 3-Series | 1014 | 1369 | -25.9% | 7462 | 9855 | -24.3% |
#2 | Audi Q5 | 791 | 665 | 18.9% | 5971 | 5492 | 8.7% |
#3 | Mercedes-Benz C-Class | 694 | 733 | -5.3% | 4958 | 7005 | -29.2% |
#4 | Lexus RX | 672 | 760 | -11.6% | 5785 | 5830 | -0.8% |
#5 | Mercedes-Benz GLK-Class | 649 | 549 | 18.2% | 4053 | 4616 | -12.2% |
#6 | Acura MDX | 523 | 468 | 11.8% | 4496 | 4521 | -0.6% |
#7 | Acura RDX | 485 | 483 | 0.4% | 4864 | 4536 | 7.2% |
#8 | BMW X5 | 461 | 478 | -3.6% | 4349 | 2565 | 69.6% |
#9 | Mercedes-Benz M-Class | 436 | 522 | -16.5% | 4206 | 3402 | 23.6% |
#10 | BMW X3 | 434 | 385 | 12.7% | 3956 | 4665 | -15.2% |
#11 | Audi A4 * | 432 | 491 | -12.0% | 4301 | 4507 | -4.6% |
#12 | BMW 4-Series | 401 | --- | --- | 2499 | --- | --- |
#13 | Audi A3 | 393 | 5 | 7760% | 1604 | 352 | 356% |
#14 | Lexus IS | 390 | 323 | 20.7% | 3094 | 1670 | 85.3% |
#15 | Mercedes-Benz E-Class & CLS-Class ^ | 386 | 317 | 21.8% | 2909 | 2330 | 24.8% |
Rank | Vehicles With Base Prices Above $50K | September 2014 | September 2013 | % Change | 2014 YTD | 2013 YTD | % Change |
#1 | BMW X5 | 461 | 478 | -3.6% | 4349 | 2565 | 69.6% |
#2 | Mercedes-Benz M-Class | 436 | 522 | -16.5% | 4206 | 3402 | 23.6% |
#3 | Mercedes-Benz E-Class & CLS-Class ^ | 386 | 317 | 21.8% | 2909 | 2330 | 24.8% |
#4 | GMC Yukon | 334 | 50 | 568% | 1440 | 1052 | 36.9% |
#5 | BMW X6 | 311 | 128 | 143% | 692 | 643 | 7.6% |
#6 | Chevrolet Tahoe | 261 | 119 | 119% | 1358 | 1242 | 9.3% |
#7 | BMW 5-Series | 242 | 269 | -10.0% | 1714 | 1767 | -3.0% |
#8 | Volkswagen Touareg | 240 | 154 | 55.8% | 1674 | 1550 | 8.0% |
#9 | Mercedes-Benz GL-Class | 199 | 250 | -20.4% | 1812 | 1864 | -2.8% |
#10 | GMC Yukon XL | 172 | 169 | 1.8% | 1348 | 810 | 66.4% |
#11 | Cadillac Escalade | 153 | 69 | 122% | 550 | 614 | -10.4% |
Cadillac Escalade ° | 120 | 44 | 173% | 413 | 332 | 24.4% | |
Cadillac Escalade ESV ° | 33 | 14 | 136% | 131 | 104 | 26.0% | |
Cadillac Escalade EXT ° | --- | 11 | -100% | 6 | 178 | -96.6% | |
#12 | Land Rover Range Rover Sport | 141 | 218 | -35.3% | 1912 | 1211 | 57.9% |
#13 | Audi Q7 | 141 | 195 | -27.7% | 1457 | 1377 | 5.8% |
T14 | Audi A6 | 136 | 111 | 22.5% | 893 | 784 | 13.9% |
T14 | Porsche Macan | 136 | --- | -- | 798 | --- | --- |
* A4 sales include sales of the unreported Allroad.
^ Mercedes-Benz Canadas figures combine the E-Class with the CLS and the S-Class with the CL.
° Escalade breakdown by variant
$50,000 CDN (before delivery) is an arbitrary borderline, but if GCBC was to follow this new system of designating only expensive vehicles as luxury vehicles, $50K seemed like a safe place to begin - it equals the average U.S. new car transaction price plus $15,000, plus another $5000 to account for Canadian increases. Plenty of less expensive vehicles with specific models feature prices above $50,000 - M, RS, and AMG models come to mind, specifically - but in the case of this list, we know that none of the registrations were of cars priced at $35,900, as would be the case with the BMW 320i, which costs less than a Hyundai Santa Fe 2.0T Limited. The biggest problem with a $50,000 minimum price of entry? Cars like the Cadillac XTS, which starts at $49,440, sporty cars like the $49,500 Audi TT, and SUVs like the $49,990 Acura MDX. Volkswagen recently increased the base Touaregs price to $50,975; GM jacked up the base Yukon price up to $51,090.
The new Cadillac CTS sedans base price is above $50,000, but not the base price for other cars in the CTS lineup. Yet. Total CTS sales in September:
Total Infiniti G/Q50/Q60 volume: 276 in September; 2853 YTD.
RECOMMENDED READING
Top 15 Best-Selling Luxury Vehicles In Canada - October 2014
Top 15 Best-Selling Luxury Vehicles In Canada - August 2014
Top 15 Best-Selling Luxury Vehicles In America - September 2013
Top 20 Best-Selling Cars In Canada - September 2014
Top 30 Best-Selling Vehicles In Canada - September 2014
Top 20 Best-Selling SUVs In Canada - September 2014
Canada Auto Sales Brand Rankings - September 2014 YTD
Top 30 Best-Selling Vehicles In Canada - September 2014
Top 20 Best-Selling SUVs In Canada - September 2014
Canada Auto Sales Brand Rankings - September 2014 YTD
Minivan Sales In America September 2014 YTD
• All Makes & Models Ranked By September 2014 YTD U.S. Sales
 |
| Click Chart To Expand |
You can click any model name in the tables below to find historical monthly and yearly U.S. auto sales data. You can also select a make and model at GCBCs Sales Stats page. This table is now sortable, so you can rank minivans any which way you like. Suggestions on how GCBC should break down segments can be passed on through the Contact page.
Click Column Headers To Sort • October 2014 • August 2014 • September 2013
Minivan | September 2014 | September 2013 | % Change | 2014 YTD | 2013 YTD | % Change |
|---|---|---|---|---|---|---|
Chrysler Town & Country | 13,029 | 10,632 | 22.5% | 108,340 | 90,701 | 19.4% |
Dodge Grand Caravan | 11,275 | 10,946 | 3.0% | 104,071 | 91,570 | 13.7% |
Honda Odyssey | 8769 | 7714 | 13.7% | 95,460 | 98,511 | -3.1% |
Kia Sedona | 613 | 657 | -6.7% | 5656 | 5380 | 5.1% |
Mazda 5 | 535 | 539 | -0.7% | 10,021 | 11,384 | -12.0% |
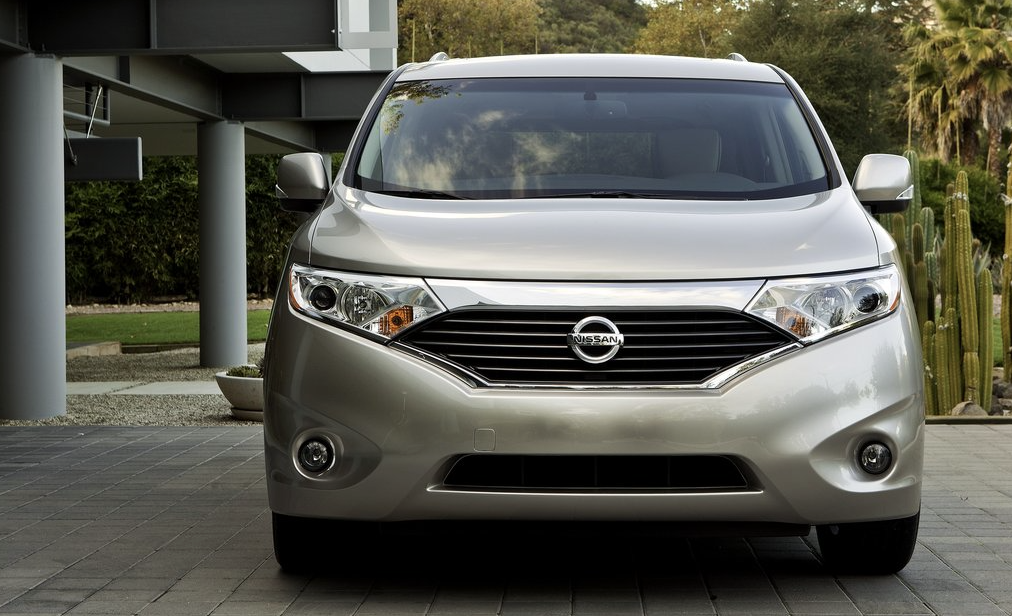
Nissan Quest | 395 | 996 | -60.3% | 8295 | 10,426 | -20.4% |
Toyota Sienna | 8592 | 9306 | -7.7% | 94,930 | 94,331 | 0.6% |
Volkswagen Routan | --- | 232 | -100% | 1103 | 1462 | -24.6% |
--- | --- | --- | --- | --- | --- | --- |
Total | 43,208 | 41,022 | 5.3% | 427,876 | 403,765 | 6.0% |
RECOMMENDED READING
Minivan Sales In America - October 2014 YTD
Minivan Sales In America - August 2014 YTD
Minivan Sales In America - September 2013 YTD
U.S. Auto Sales Brand Rankings - September 2014 YTD
Commercial Van Sales In America - September 2014 YTD
Tuesday, March 24, 2015
Large SUV Sales In Canada September 2014 YTD

• Canada Vehicle Sales Rankings By Model - September 2014 YTD
• Canada SUV/Crossover Sales Rankings By Model - September 2014 YTD
 |
| Click Chart To Expand |
The Tahoe and Yukon, GMs two shorter-wheelbase full-size SUVs, were the major players, outselling their respective long-wheelbase siblings by 4-to-1 and 1.9-to-1.
Combined with the Cadillac Escalade and Escalade ESV, GMs full-size SUV family generated 4% of GM Canada volume last month.
Meanwhile, Ford sold 91 Expeditions, Max-inclusive. Nissan Armada volume fell by one unit to 51. Toyota Sequoia sales slid 36% to a worst-in-segment 42 units.
You can click any model name in the tables below to find historical monthly and yearly Canada auto sales data. You can also select a make and model at GCBCs Sales Stats page. These tables are now sortable, so you can rank large sport-utility vehicles any which way you like. Suggestions on how GCBC should break down segments can be passed on through the Contact page.
Click Column Headers To Sort • October 2014 • August 2014 • September 2013
SUV | September 2014 | September 2013 | % Change | 2014 YTD | 2013 YTD | % Change |
|---|---|---|---|---|---|---|
Chevrolet Suburban | 64 | 109 | -41.3% | 670 | 876 | -23.5% |
Chevrolet Tahoe | 261 | 119 | 119% | 1358 | 1242 | 9.3% |
Ford Expedition | 91 | 64 | 42.2% | 993 | 1160 | -14.4% |
GMC Yukon | 334 | 50 | 1440 | 1052 | 36.9% | |
GMC Yukon XL | 172 | 169 | 1.8% | 1348 | 810 | 66.4% |
Nissan Armada | 51 | 52 | -1.9% | 334 | 405 | -17.5% |
Toyota Sequoia | 42 | 66 | -36.4% | 535 | 531 | 0.8% |
--- | --- | --- | --- | --- | ||
Total | 1015 | 629 | 61.4% | 6678 | 6076 | 9.9% |
RECOMMENDED READING
Large SUV Sales In Canada - October 2014 YTD
Large SUV Sales In Canada - August 2014 YTD
Large SUV Sales In Canada - September 2013 YTD
Canada Auto Sales Brand Rankings - September 2014 YTD
Top 20 Best-Selling SUVs In Canada - September 2014
Midsize SUV Sales In Canada - September 2014 YTD
Friday, March 20, 2015
September 2014 Canada Passenger Car Sales Rankings Top 143 Best Selling Cars In Canada Every Car Ranked

Canadas passenger car market, unhealthy in a record-setting overall new vehicle industry through the first five months of the year, rose 3.8% in June, 6.1% in July, 1.4% in August, and 2.1% in September 2014.
The Honda Civic accounts for nearly 9% of the Canadian car market and propels much of the growth. Non-Civic car sales were up just 1.8% last month.
• Canada Auto Sales Brand Rankings - September 2014 YTD
• Canada SUV/Crossover Sales Rankings By Model - September 2014 YTD
The new Toyota Corolla (up 14% this year) is also set to challenge the Hyundai Elantra for the number-two position by years end, but Corolla sales dropped slightly last month.
Indeed, the majority of top sellers are more successful in Canada this year than they were last year, but smaller players have been a drag on the overall category.
Excluding the 30 top-selling cars from the equation, the lower 80% (which account for just 27% of the car categorys volume through the first nine months of 2014) are collectively down 1.8%.
Meanwhile, those 30 top sellers, from Honda Civic to Volkswagen Passat, are up 0.6%.
• Canada Car Sales Rankings By Model - October 2014 YTD
• Canada Car Sales Rankings By Model - August 2014 YTD
• Canada Car Sales Rankings By Model - September 2013 YTD
New to these rankings this month is the Acura TLX, which generated 23% of Acuras Canadian sales volume in September.
Reminder: these are 2014 year-to-date rankings, but you can sort vehicles by September volume by clicking the September 2014 column header, or you can rank vehicles by improvements or declines using the % columns. Or, most importantly, you can list automakers together by selecting the Car column header. At any time, click the Rank column to return to the original format. If youre on a mobile device, you may need to choose the full version of the site (at the bottom of the page) in order to use the sortable function.
• Top 20 Best-Selling Cars In Canada - September 2014
• Top 20 Best-Selling SUVs In Canada - September 2014
• Canada Truck Sales By Model - September 2014 YTD
• Canada Minivan Sales By Model - September 2014 YTD
• Canada Commercial Van Sales By Model - September 2014 YTD
As always, you can find historical monthly and yearly sales figures for any of these vehicles by selecting a make and model at GCBCs Sales Stats page.
Click Column Headers To Sort • October 2014 • August 2014 • September 2013
Rank | Car | September 2014 YTD | September 2013 YTD | % Change | September 2014 | September 2013 | % Change |
|---|---|---|---|---|---|---|---|
| #1 | Honda Civic | 51,936 | 48,098 | 8.0% | 6,886 | 6,262 | 10.0% |
| #2 | Hyundai Elantra | 40,060 | 44,345 | -9.7% | 3,562 | 5,055 | -29.5% |
| #3 | Toyota Corolla | 39,035 | 34,118 | 14.4% | 4,409 | 4,459 | -1.1% |
| #4 | Mazda 3 | 33,016 | 30,203 | 9.3% | 3,849 | 3,310 | 16.3% |
| #5 | Chevrolet Cruze | 26,178 | 25,363 | 3.2% | 3,229 | 2,637 | 22.4% |
| #6 | Volkswagen Jetta | 25,216 | 23,298 | 8.2% | 2,381 | 3,006 | -20.8% |
| #7 | Hyundai Accent | 18,741 | 15,793 | 18.7% | 2,419 | 1,837 | 31.7% |
| #8 | Ford Focus | 17,882 | 20,904 | -14.5% | 1,934 | 2,236 | -13.5% |
| #9 | Ford Fusion | 14,508 | 16,681 | -13.0% | 1,455 | 1,435 | 1.4% |
| #10 | Honda Accord | 13,483 | 13,420 | 0.5% | 1,465 | 1,333 | 9.9% |
| #11 | Kia Rio | 12,092 | 13,006 | -7.0% | 1,280 | 1,363 | -6.1% |
| #12 | Toyota Camry | 12,008 | 13,963 | -14.0% | 1,297 | 1,991 | -34.9% |
| #13 | Nissan Sentra | 11,596 | 11,495 | 0.9% | 1,550 | 988 | 56.9% |
| #14 | Nissan Versa | 11,294 | 8,760 | 28.9% | 772 | 1,406 | -45.1% |
| #15 | Hyundai Sonata | 10,611 | 11,168 | -5.0% | 1,535 | 640 | 140% |
| #16 | Kia Forte | 9,226 | 9,161 | 0.7% | 898 | 744 | 20.7% |
| #17 | Volkswagen Golf | 8,061 | 9,507 | -15.2% | 2,073 | 1,030 | 101% |
| #18 | Kia Soul | 7,927 | 6,053 | 31.0% | 1,019 | 669 | 52.3% |
| #19 | Subaru Impreza | 7,918 | 7,635 | 3.7% | 885 | 876 | 1.0% |
| #20 | Chrysler 200 | 7,864 | 10,014 | -21.5% | 936 | 979 | -4.4% |
| #20.1 | Chrysler 200 Sedan * | 7,850 | 9,412 | -16.6% | 936 | 969 | -3.4% |
| #20.2 | Chrysler 200 Convertible * | 14 | 602 | -97.7% | --- | 10 | -100% |
| #21 | Nissan Altima | 7,719 | 8,231 | -6.2% | 730 | 1,226 | -40.5% |
| #22 | Honda Fit | 7,652 | 5,975 | 28.1% | 381 | 799 | -52.3% |
| #23 | BMW 3-Series | 7,462 | 9,855 | -24.3% | 1,014 | 1,369 | -25.9% |
| #24 | Ford Fiesta | 7,371 | 7,998 | -7.8% | 701 | 1,153 | -39.2% |
| #25 | Toyota Yaris | 6,801 | 6,042 | 12.6% | 791 | 495 | 59.8% |
| #26 | Dodge Dart | 6,518 | 7,509 | -13.2% | 560 | 683 | -18.0% |
| #27 | Kia Optima | 6,424 | 8,051 | -20.2% | 425 | 975 | -56.4% |
| #28 | Chevrolet Sonic | 6,345 | 7,573 | -16.2% | 554 | 808 | -31.4% |
| #29 | Toyota Venza | 6,202 | 7,007 | -11.5% | 650 | 612 | 6.2% |
| #30 | Volkswagen Passat & CC ¤ | 6,057 | 5,696 | 6.3% | 638 | 708 | -9.9% |
| #31 | Toyota Matrix | 5,939 | 9,122 | -34.9% | 551 | 659 | -16.4% |
| #32 | Subaru Outback | 5,812 | 4,567 | 27.3% | 936 | 548 | 70.8% |
| #33 | Buick Verano | 5,634 | 4,498 | 25.3% | 874 | 396 | 121% |
| #34 | Subaru XV Crosstrek | 5,366 | 4,405 | 21.8% | 672 | 573 | 17.3% |
| #35 | Chevrolet Malibu | 5,345 | 5,265 | 1.5% | 1,168 | 380 | 207% |
| #36 | Nissan Micra | 5,096 | --- | --- | 969 | --- | --- |
| #37 | Mitsubishi Lancer | 5,045 | 6,049 | -16.6% | 570 | 528 | 8.0% |
| #38 | Mercedes-Benz C-Class | 4,958 | 7,005 | -29.2% | 694 | 733 | -5.3% |
| #39 | Fiat 500 | 4,779 | 5,803 | -17.6% | 307 | 455 | -32.5% |
| #39.1 | Fiat 500 * | 3,391 | 4,200 | -19.3% | 220 | 349 | -37.0% |
| #39.2 | Fiat 500C * | 1,388 | 1,603 | -13.4% | 87 | 106 | -17.9% |
| #40 | Ford Mustang | 4,391 | 4,571 | -3.9% | 292 | 328 | -11.0% |
| #41 | Audi A4 º | 4,301 | 4,507 | -4.6% | 432 | 491 | -12.0% |
| #42 | Chrysler 300 | 3,543 | 4,652 | -23.8% | 245 | 214 | 14.5% |
| #43 | Mitsubishi Mirage | 3,260 | 81 | 3,925% | 247 | 81 | 205% |
| #44 | Dodge Charger | 3,153 | 3,971 | -20.6% | 340 | 524 | -35.1% |
| #45 | Lexus IS | 3,094 | 1,670 | 85.3% | 390 | 323 | 20.7% |
| #45.1 | Lexus IS250/IS350 Sedan * | 2,962 | 1,456 | 103% | 383 | 313 | 22.4% |
| #45.2 | Lexus ISC * | 115 | 185 | -37.8% | 6 | 8 | -25.0% |
| #45.3 | Lexus ISF * | 17 | 29 | -41.4% | 1 | 2 | -50.0% |
| #46 | Mercedes-Benz E-Class & CLS-Class ¤ | 2,909 | 2,330 | 24.8% | 386 | 317 | 21.8% |
| #47 | Nissan Frontier | 2,813 | 2,130 | 32.1% | 494 | 207 | 139% |
| #48 | Hyundai Veloster | 2,803 | 3,894 | -28.0% | 262 | 361 | -27.4% |
| #49 | Ford Taurus | 2,788 | 3,648 | -23.6% | 194 | 224 | -13.4% |
| #50 | Mercedes-Benz CLA-Class | 2,730 | 108 | 2,428% | 326 | 108 | 202% |
| #51 | Chevrolet Camaro | 2,630 | 1,964 | 33.9% | 143 | 115 | 24.3% |
| #52 | Cadillac ATS | 2,612 | 2,163 | 20.8% | 264 | 268 | -1.5% |
| #53 | BMW 4-Series | 2,499 | --- | --- | 401 | --- | --- |
| #54 | Infiniti Q50 ± | 2,497 | 1,861 | 34.2% | 239 | 357 | -33.1% |
| #55 | Chevrolet Impala | 2,480 | 3,268 | -24.1% | 217 | 251 | -13.5% |
| #56 | Mazda 6 | 2,428 | 3,686 | -34.1% | 225 | 295 | -23.7% |
| #57 | Acura ILX | 2,220 | 2,678 | -17.1% | 219 | 169 | 29.6% |
| #58 | Mercedes-Benz B-Class | 2,121 | 2,426 | -12.6% | 222 | 250 | -11.2% |
| #59 | Toyota Prius C ² | 2,101 | 2,347 | -10.5% | 201 | 260 | -22.7% |
| #60 | Fiat 500L | 2,053 | 580 | 254% | 133 | 134 | -0.7% |
| #61 | Lexus ES | 2,038 | 2,432 | -16.2% | 236 | 300 | -21.3% |
| #62 | Mini Cooper † | 1,911 | 3,012 | -36.6% | 104 | 280 | -62.9% |
| #63 | Toyota Prius V ² | 1,868 | 2,126 | -12.1% | 233 | 229 | 1.7% |
| #64 | Subaru Legacy | 1,849 | 1,459 | 26.7% | 310 | 236 | 31.4% |
| #65 | Mazda 2 | 1,836 | 3,257 | -43.6% | 184 | 266 | -30.8% |
| #66 | Audi A5 | 1,805 | 1,831 | -1.4% | 155 | 147 | 5.4% |
| #67 | Smart Fortwo | 1,725 | 1,676 | 2.9% | 247 | 435 | -43.2% |
| #68 | BMW 5-Series | 1,714 | 1,767 | -3.0% | 242 | 269 | -10.0% |
| #69 | Volkswagen Beetle | 1,616 | 1,953 | -17.3% | 171 | 148 | 15.5% |
| #70 | Audi A3 | 1,604 | 352 | 356% | 393 | 5 | 7,760% |
| #71 | Volvo S60/V60 | 1,498 | 1,024 | 46.3% | 116 | 111 | 4.5% |
| #72 | Toyota Prius ² | 1,488 | 1,973 | -24.6% | 162 | 196 | -17.3% |
| #72.1 | Toyota Prius Sedan * | 1,425 | 1,783 | -20.1% | 151 | 189 | -20.1% |
| #72.2 | Toyota Prius Plug-In * | 63 | 190 | -66.8% | 11 | 7 | 57.1% |
| #73 | Chevrolet Spark | 1,341 | 2,018 | -33.5% | 135 | 261 | -48.3% |
| #74 | Scion FR-S | 1,334 | 1,557 | -14.3% | 149 | 103 | 44.7% |
| #75 | Dodge Challenger | 1,331 | 1,395 | -4.6% | 163 | 82 | 98.8% |
| #76 | Chevrolet Volt | 1,294 | 656 | 97.3% | 145 | 59 | 146% |
| #77 | Hyundai Genesis Coupe ‡ | 1,291 | 1,570 | -17.8% | 111 | 138 | -19.6% |
| #78 | Acura TL | 1,288 | 1,763 | -26.9% | 39 | 296 | -86.8% |
| #79 | Hyundai Genesis Sedan ‡ | 1,186 | 784 | 51.3% | 113 | 49 | 131% |
| #80 | Ford C-Max | 1,168 | 1,133 | 3.1% | 141 | 123 | 14.6% |
| #81 | Lincoln MKZ | 1,167 | 1,133 | 3.0% | 108 | 195 | -44.6% |
| #82 | Buick LaCrosse | 1,118 | 933 | 19.8% | 307 | 92 | 234% |
| #83 | Chevrolet Corvette | 1,029 | 148 | 595% | 65 | 11 | 491% |
| #84 | Scion tC | 972 | 1,176 | -17.3% | 118 | 159 | -25.8% |
| #85 | Audi A6 | 893 | 784 | 13.9% | 136 | 111 | 22.5% |
| #86 | Lexus CT200h | 828 | 804 | 3.0% | 107 | 107 | 0.0% |
| #87 | Subaru BRZ | 809 | 911 | -11.2% | 59 | 95 | -37.9% |
| #88 | Nissan Leaf | 805 | 382 | 111% | 113 | 36 | 214% |
| #89 | Cadillac CTS | 794 | 702 | 13.1% | 67 | 83 | -19.3% |
| #90 | Toyota Avalon | 767 | 985 | -22.1% | 86 | 52 | 65.4% |
| #91 | Mercedes-Benz S-Class & CL-Class ¤ | 758 | 319 | 138% | 73 | 15 | 387% |
| #92 | Audi A7 | 757 | 528 | 43.4% | 57 | 74 | -23.0% |
| #93 | Honda Crosstour | 680 | 901 | -24.5% | 116 | 68 | 70.6% |
| #94 | Nissan Maxima | 662 | 1,154 | -42.6% | 52 | 181 | -71.3% |
| #95 | Porsche 911 | 648 | 537 | 20.7% | 64 | 58 | 10.3% |
| #96 | Buick Regal | 607 | 530 | 14.5% | 134 | 50 | 168% |
| #97 | BMW 2-Series | 567 | --- | --- | 101 | --- | --- |
| #98 | Scion xB | 520 | 656 | -20.7% | 50 | 68 | -26.5% |
| #99 | Cadillac XTS | 513 | 558 | -8.1% | 47 | 54 | -13.0% |
| #100 | Dodge Avenger | 485 | 6,991 | -93.1% | 6 | 670 | -99.1% |
| #101 | Mazda MX-5 Miata | 480 | 503 | -4.6% | 29 | 24 | 20.8% |
| #102 | Jaguar XF | 434 | 435 | -0.2% | 52 | 46 | 13.0% |
| #103 | Volvo XC70 | 407 | 482 | -15.6% | 55 | 61 | -9.8% |
| #104 | Volkswagen Eos | 384 | 450 | -14.7% | 32 | 21 | 52.4% |
| T105 | Acura TLX | 381 | --- | --- | 381 | --- | --- |
| T105 | Lexus GS | 381 | 518 | -26.4% | 28 | 56 | -50.0% |
| #107 | Jaguar F-Type | 366 | 186 | 96.8% | 33 | 31 | 6.5% |
| #108 | Infiniti Q60/G ± | 356 | 436 | -18.3% | 37 | 32 | 15.6% |
| #109 | Nissan 370Z | 343 | 398 | -13.8% | 31 | 33 | -6.1% |
| #110 | BMW 6-Series | 341 | 332 | 2.7% | 24 | 45 | -46.7% |
| #111 | Porsche Boxster | 311 | 341 | -8.8% | 38 | 21 | 81.0% |
| #112 | Mercedes-Benz SLK-Class | 304 | 312 | -2.6% | 24 | 21 | 14.3% |
| T113 | Mercedes-Benz SL-Class | 298 | 360 | -17.2% | 18 | 37 | -51.4% |
| T113 | Porsche Panamera | 298 | 254 | 17.3% | 39 | 52 | -25.0% |
| #115 | Scion iQ | 280 | 387 | -27.6% | 24 | 32 | -25.0% |
| #116 | Jaguar XJ | 279 | 278 | 0.4% | 44 | 34 | 29.4% |
| #117 | BMW 7-Series | 277 | 248 | 11.7% | 34 | 46 | -26.1% |
| #118 | Audi TT | 266 | 307 | -13.4% | 26 | 31 | -16.1% |
| #119 | Scion xD | 230 | 301 | -23.6% | 18 | 25 | -28.0% |
| #120 | Porsche Cayman | 216 | 191 | 13.1% | 19 | 18 | 5.6% |
| #121 | Acura TSX | 205 | 569 | -64.0% | --- | 70 | -100% |
| #122 | Acura RLX/RL ¤ | 202 | 127 | 59.1% | 16 | 28 | -42.9% |
| #123 | Audi A8 | 193 | 210 | -8.1% | 22 | 24 | -8.3% |
| #233 | Lincoln MKS | 176 | 205 | -14.1% | 14 | 25 | -44.0% |
| #124 | BMW Z4 | 141 | 217 | -35.0% | 6 | 11 | -45.5% |
| #125 | BMW i3 | 139 | --- | --- | 23 | - | - |
| #126 | Lexus LS | 133 | 157 | -15.3% | 7 | 5 | 40.0% |
| #127 | Kia Cadenza | 114 | 140 | -18.6% | 21 | 47 | -55.3% |
| #128 | Nissan GT-R | 109 | 110 | -0.9% | 10 | 15 | -33.3% |
| #129 | Audi R8 | 100 | 96 | 4.2% | 9 | 7 | 28.6% |
| #130 | Dodge Viper | 87 | 35 | 149% | 7 | 9 | -22.2% |
| #131 | Mitsubishi i MiEV | 86 | 140 | -38.6% | 7 | 12 | -41.7% |
| #132 | Honda CR-Z | 83 | 56 | 48.2% | 11 | 4 | 175% |
| T133 | Jaguar XK | 73 | 79 | -7.6% | 6 | 10 | -40.0% |
| T133 | Infiniti Q70/M | 73 | 215 | -66.0% | 18 | 33 | -45.5% |
| #135 | Hyundai Equus | 56 | 62 | -9.7% | 4 | 8 | -50.0% |
| #136 | Volvo S80 | 48 | 41 | 17.1% | 1 | 8 | -87.5% |
| #137 | Mercedes-Benz SLS AMG | 36 | 50 | -28.0% | 1 | 8 | -87.5% |
| #138 | Cadillac ELR | 31 | --- | --- | 3 | --- | --- |
| #139 | Kia K900 | 21 | --- | --- | 5 | --- | --- |
| #140 | Nissan Cube | 15 | 156 | -90.4% | --- | 16 | -100% |
| #141 | Porsche 918 Spyder | 5 | --- | --- | 2 | --- | --- |
| #142 | BMW 1-Series | 2 | 572 | -99.7% | --- | 25 | -100% |
| #143 | Lexus LFA | 1 | 1 | 0.0% | --- | --- | --- |
| #264 | Suzuki SX4 | --- | 1,391 | -100% | --- | 113 | -100% |
| #267 | Volvo C30 | --- | 301 | -100% | --- | 8 | -100% |
| #268 | Suzuki Kizashi | --- | 214 | -100% | --- | 33 | -100% |
| #269 | Volvo C70 | --- | 117 | -100% | --- | 11 | -100% |
| #270 | Mercedes-Benz R-Class | --- | 112 | -100% | --- | 3 | -100% |
| #272 | Honda Insight | --- | 63 | -100% | --- | 3 | -100% |
| #274 | Dodge Caliber | --- | 7 | -100% | --- | --- | --- |
| #275 | Mitsubishi Eclipse | --- | 3 | -100% | --- | --- | --- |
| #276 | Mercedes-Benz SLR McLaren | --- | 1 | -100% | --- | --- | --- |
--- | --- | --- | --- | --- | --- | --- | --- |
--- | Total | 607,115 | 610,077 | -0.5% | 68,991 | 67,540 | 2.1% |
* Italicized unranked lines are nothing more than available breakdowns, already included in the models total, not in addition to the models total.
² Total Prius Family sales: down 13% to 596 in September down 15.3% to 5457 YTD.
† Mini Cooper includes sales of the Hardtop, Convertible, Clubman, Coupe, Roadster, and Paceman.
‡ Total Genesis sales: up 19.8% to 224 in September; up 5.2% to 2477 YTD.
± Total Infiniti G/Q50/Q60 sales: down 29% to 276 in September; up 24.2% to 2853 YTD.
¤ Automakers release sales figures for the E-Class and CLS-Class together, S-Class and CL-Class together, RL and RLX together, Passat and CC together.
º Audis A4 sales data includes sales of the Allroad.
Sales data for brands such as Bentley, Ferrari, Lamborghini, and Rolls-Royce are unfortunately not broken down by model. ANDC estimates say sales for those brands during the first nine months of 2014 were 103, 155, 85, and 54, respectively. Total Maserati volume is reported, but not by specific models. It is believed that Tesla sold 25 copies of their Model S back in August 2014 (and 467 YTD), but Tesla doesnt issue monthly sales reports. The ANDC estimate for Tesla August sales in Canada was 50 units.
Subscribe to:
Posts (Atom)