Showing posts with label top. Show all posts
Showing posts with label top. Show all posts
Saturday, March 28, 2015
Top 20 Best Selling Cars In America September 2014
• All Makes & Models Ranked By September 2014 YTD U.S. Sales
• U.S. Car Sales Rankings By Model - September 2014 YTD
Accord sales jumped 31% last month; Camry sales slid 11%. The next-best-selling Honda Civic was down 3%. The sixth, seventh, ninth, 17th, 19th, and 20th-best-selling cars in America all reported declining year-over-year sales in September, as well, and this in a market which shot up 9.4% to more than 1.25 million units.
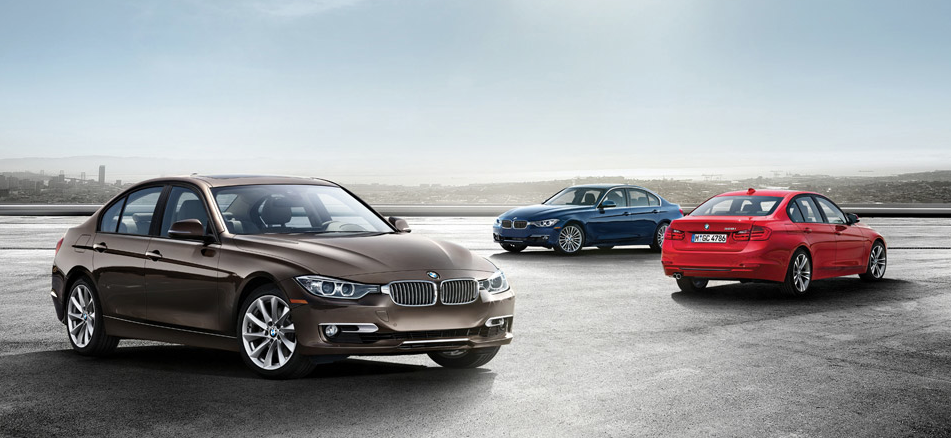
In addition to the Accords big jump, sales of the Chevrolet Cruze, Nissan Sentra, Nissan Versa, Subaru Outback, and Kia Soul all climbed far beyond their September 2013 tallies. Likewise, the BMW 3-Series (sales figures for which include the 4-Series in the U.S.) were half again as strong as they were a year ago. No premium brand car came close to selling as often as the BMW duo, with its wide-spread range encompassing a pair of hatchbacks, a sedan, a coupe, a convertible, and a wagon.
Historical monthly and yearly sales figures for any of these best-selling cars can always be accessed through the dropdown menu at GCBCs Sales Stats page, and for those not viewing the mobile version of this site, near the top right of this page, as well. GoodCarBadCar has already published the list of Americas best-selling trucks and will shortly publish the list of Americas best-selling SUVs in September 2014.
October 2014 • August 2014 • September 2013
Rank | Best-Selling Car | September 2014 | September 2013 | % Change | 2014 YTD | 2013 YTD | % Change |
#1 | Honda Accord | 32,956 | 25,176 | 30.9% | 304,382 | 282,102 | 7.9% |
#2 | Toyota Camry | 28,507 | 31,871 | -10.6% | 334,978 | 318,990 | 5.0% |
#3 | Honda Civic | 22,263 | 22,983 | -3.1% | 253,430 | 253,561 | -0.1% |
#4 | Ford Fusion | 21,693 | 19,972 | 8.6% | 240,585 | 226,293 | 6.3% |
#5 | Nissan Altima | 21,675 | 21,221 | 2.1% | 256,935 | 249,518 | 3.0% |
#6 | Toyota Corolla/Matrix | 20,530 | 23,251 | -11.7% | 258,805 | 233,547 | 10.8% |
#7 | Hyundai Elantra | 18,848 | 19,691 | -4.3% | 176,403 | 194,593 | -9.3% |
#8 | Chevrolet Cruze | 18,415 | 12,730 | 44.7% | 208,114 | 195,775 | 6.3% |
#9 | Ford Focus | 15,397 | 16,733 | -8.0% | 176,156 | 188,654 | -6.6% |
#10 | Chevrolet Malibu | 15,186 | 14,487 | 4.8% | 148,574 | 154,950 | -4.1% |
#11 | Hyundai Sonata | 14,918 | 13,872 | 7.5% | 164,934 | 152,702 | 8.0% |
#12 | BMW 3-Series/4-Series * | 12,814 | 8512 | 50.5% | 94,445 | 77,921 | 21.2% |
#13 | Nissan Sentra | 12,557 | 7798 | 61.0% | 141,216 | 98,281 | 43.7% |
#14 | Nissan Versa | 12,072 | 8776 | 37.6% | 110,272 | 91,535 | 20.5% |
#15 | Subaru Outback ^ | 11,315 | 8143 | 39.0% | 97,266 | 90,073 | 8.0% |
#16 | Chrysler 200 | 10,995 | 9583 | 14.7% | 75,142 | 102,859 | -26.9% |
#17 | Kia Optima | 10,908 | 11,647 | -6.3% | 122,646 | 124,056 | -1.1% |
#18 | Kia Soul | 10,802 | 7416 | 45.7% | 115,579 | 90,624 | 27.5% |
#19 | Volkswagen Jetta | 10,245 | 13,309 | -23.0% | 115,055 | 124,273 | -7.4% |
#20 | Chevrolet Impala | 9225 | 11,462 | -19.5% | 107,162 | 121,033 | -11.5% |
* BMW USA, not GoodCarBadCar, chooses to combined sales of the 3-Series and 4-Series.
^GCBC will be displaying the Outback with cars until at least the end of the year. As an SUV/crossover, it would have ranked 11th in September.
RECOMMENDED READING
Top 20 Best-Selling Cars In America - October 2014
Top 20 Best-Selling Cars In America - August 2014
Top 20 Best-Selling Cars In America - September 2013
U.S. Auto Sales Brand Rankings - September 2014 YTD
Top 13 Best-Selling Trucks In America - September 2014 YTD
Top 20 Best-Selling SUVs In America - September 2014

Top 13 Best Selling Pickup Trucks In America August 2014 YTD

• U.S. Vehicle Sales Rankings By Model - August 2014 YTD
Year-over-year, pickup sales grew by nearly 13,000 units as Ram added 10,766 sales and GMs two remaining full-size pickups, the Chevrolet Silverado and GMC Sierra, combined for an F-Series-beating 69,048 sales, representing a 12.1% improvement. Year-to-date, the aging F-Series leads the still-fresh GM twins by 34,671 units.
Overall, the full-size portion of the category accounted for 193,997 sales, or 89.6% of the pickup market, with an 8.8% year-over-year volume improvement. Sales of small and midsize trucks fell 5.1% to 22,455 units.
You can click any model name in the table below to find historical monthly and yearly U.S. sales data. You can also select a make and model at GCBCs Sales Stats page. This table is now sortable, so you can rank pickup trucks any which way you like. August best seller lists for cars and SUVs will be published soon.
Click Column Headers To Sort • September 2014 • July 2014 • August 2013
Rank | Best-Selling Truck | August 2014 | August 2013 | % Change | 2014 YTD | 2013 YTD | % Change |
|---|---|---|---|---|---|---|---|
| #1 | Ford F-Series | 68,109 | 71,115 | -4.2% | 497,174 | 499,050 | -0.4% |
| #2 | Chevrolet Silverado | 49,201 | 43,603 | 12.8% | 331,977 | 328,269 | 1.1% |
| #3 | Ram P/U | 43,775 | 33,009 | 32.6% | 283,256 | 234,642 | 20.7% |
| #4 | GMC Sierra | 19,847 | 18,017 | 10.2% | 130,526 | 122,232 | 6.8% |
| #5 | Toyota Tacoma | 14,338 | 15,223 | -5.8% | 102,736 | 110,293 | -6.9% |
| #6 | Toyota Tundra | 11,834 | 11,365 | 4.1% | 80,133 | 72,750 | 10.1% |
| #7 | Nissan Frontier | 6770 | 6588 | 2.8% | 48,510 | 41,519 | 16.8% |
| #8 | Honda Ridgeline | 1347 | 1738 | -22.5% | 10,593 | 12,403 | -14.6% |
| #9 | Nissan Titan | 1231 | 1261 | -2.4% | 8719 | 11,281 | -22.7% |
| #10 | Chevrolet Avalanche | 5 | 1525 | -99.7% | 87 | 14,899 | -99.4% |
| #11 | Cadillac Escalade EXT | 1 | 181 | -99.4% | 50 | 1522 | -96.7% |
| #12 | Chevrolet Colorado | --- | 93 | -100% | 73 | 3334 | -97.8% |
| #13 | GMC Canyon | --- | 12 | -100% | 5 | 910 | -99.5% |
| #14 | Suzuki Equator | --- | --- | --- | --- | 448 | -100% |
--- | --- | --- | --- | --- | --- | --- | --- |
--- | Total | 216,458 | 203,730 | 6.2% | 1,493,839 | 1,453,552 | 2.8% |
RECOMMENDED READING
Top 13 Best-Selling Pickup Trucks In America - September 2014 YTD
Top 13 Best-Selling Trucks In America - July 2014 YTD
Top 14 Best-Selling Trucks In America - August 2013 YTD
U.S. Auto Sales Brand Rankings - August 2014 YTD
Top 30 Best-Selling Vehicles In America - August 2014
Top 20 Best-Selling SUVs In America - August 2014
Top 20 Best-Selling Cars In America - August 2014
Thursday, March 26, 2015
2014 Year End U S Passenger Car Sales Rankings Top 157 Best Selling Cars In America Every Car Ranked

As a result, cars generated just 48% of all new vehicle sales in the United States in 2014, down from 50% in 2013.
• U.S. Car Sales Rankings By Model - January 2015
• U.S. Car Sales Rankings By Model - November 2014 YTD
• U.S. Car Sales Rankings By Model - December & 2013 Year End
At the top of the heap, however, the best-selling cars produced a greater percentage of buyer interest in 2014. The four best-selling cars in America - Toyota Camry, Honda Accord, Toyota Corolla, Nissan Altima - generated 18.8% of the passenger car markets volume, up from the 18.4% earned by the four top sellers last year.
Yet while new cars struggled to generate momentum through much of the year, December volume was up 7%. 10 of Americas 20 top-selling cars in December reported double-digit year-over-year percentage improvements, from the category-leading Nissan Altimas 30% jump to the Chrysler 200s 187% boost.
• Top 13 Best-Selling Pickup Trucks In America - 2014 Year End
• Commercial Van Sales In America - 2014 Year End
• Minivan Sales In America - 2014 Year End
More importantly, as the overall market for cars stagnated in 2014, some brands performed well above average with their car divisions.

• U.S. Auto Sales Brand Rankings - 2014 Year End
• U.S. Vehicle Sales Rankings By Model - December & 2014 Year End
• U.S. SUV/Crossover Sales Rankings By Model - 2014 Year End
Reminder: these are calendar year 2014 rankings, but you can sort cars by December volume by clicking the December 2014 column header, or you can rank carss by improvements or declines using the % columns. Or, most importantly, you can list automakers together by selecting the Car column header.
As always, you can find historical monthly and yearly sales figures for any of these vehicles by selecting a make and model at GCBCs Sales Stats page.
Click Column Headers To Sort • January 2015 • November 2014 • December 2013
Rank | Car | 2014 | 2013 | % Change | December 2014 | December 2013 | % Change |
|---|---|---|---|---|---|---|---|
| #1 | Toyota Camry | 428,606 | 408,484 | 4.9% | 31,618 | 29,964 | 5.5% |
| #2 | Honda Accord | 388,374 | 366,678 | 5.9% | 31,589 | 32,321 | -2.3% |
| #3 | Toyota Corolla/Matrix | 339,498 | 302,180 | 12.4% | 30,125 | 22,562 | 33.5% |
| #4 | Nissan Altima | 335,644 | 320,723 | 4.7% | 32,331 | 24,816 | 30.3% |
| #5 | Honda Civic | 325,981 | 336,180 | -3.0% | 25,337 | 29,000 | -12.6% |
| #6 | Ford Fusion | 306,860 | 295,280 | 3.9% | 23,166 | 24,408 | -5.1% |
| #7 | Chevrolet Cruze | 273,060 | 248,224 | 10.0% | 17,800 | 18,162 | -2.0% |
| #8 | Hyundai Elantra | 222,023 | 247,912 | -10.4% | 18,860 | 21,692 | -13.1% |
| #9 | Ford Focus | 219,634 | 234,570 | -6.4% | 14,883 | 15,569 | -4.4% |
| #10 | Hyundai Sonata | 216,936 | 203,648 | 6.5% | 17,924 | 14,479 | 23.8% |
| #11 | Chevrolet Malibu | 188,519 | 200,594 | -6.0% | 16,817 | 15,493 | 8.5% |
| #12 | Nissan Sentra | 183,268 | 129,143 | 41.9% | 15,393 | 10,799 | 42.5% |
| #13 | Volkswagen Jetta | 160,873 | 163,793 | -1.8% | 15,578 | 15,393 | 1.2% |
| #13.1 | Volkswagen Jetta Sedan * | 141,354 | 141,259 | 0.1% | 14,572 | 13,719 | 6.2% |
| #13.2 | Volkswagen Jetta SportWagen * | 19,519 | 22,534 | -13.4% | 1,006 | 1,674 | -39.9% |
| #14 | Kia Optima | 159,020 | 155,893 | 2.0% | 11,827 | 9,474 | 24.8% |
| #15 | Kia Soul | 145,316 | 118,079 | 23.1% | 9,906 | 6,345 | 56.1% |
| #16 | BMW 3-Series & 4-Series ³ | 142,232 | 119,521 | 19.0% | 19,464 | 16,737 | 16.3% |
| #17 | Chevrolet Impala | 140,280 | 156,797 | -10.5% | 13,088 | 10,633 | 23.1% |
| #18 | Nissan Versa | 139,781 | 117,352 | 19.1% | 9,129 | 8,864 | 3.0% |
| #19 | Subaru Outback | 138,790 | 118,049 | 17.6% | 14,772 | 11,002 | 34.3% |
| #20 | Toyota Prius ² | 136,040 | 157,260 | -13.5% | 9,291 | 10,800 | -14.0% |
| #20.1 | Toyota Prius Sedan * | 122,776 | 145,172 | -15.4% | 8,799 | 9,881 | -11.0% |
| #20.2 | Toyota Prius Plug-In * | 13,264 | 12,088 | 9.7% | 492 | 919 | -46.5% |
| #21 | Chrysler 200 | 117,363 | 122,480 | -4.2% | 16,229 | 5,652 | 187% |
| #22 | Mazda 3 | 104,985 | 104,713 | 0.3% | 9,719 | 7,669 | 26.7% |
| #23 | Volkswagen Passat | 96,649 | 109,652 | -11.9% | 8,257 | 9,254 | -10.8% |
| #24 | Dodge Charger | 94,099 | 98,336 | -4.3% | 8,422 | 10,145 | -17.0% |
| #25 | Chevrolet Sonic | 93,518 | 85,646 | 9.2% | 5,456 | 4,435 | 23.0% |
| #26 | Chevrolet Camaro | 86,297 | 80,567 | 7.1% | 6,628 | 5,015 | 32.2% |
| #27 | Dodge Dart | 83,858 | 83,388 | 0.6% | 6,881 | 5,449 | 26.3% |
| #28 | Subaru Impreza | 83,488 | 76,825 | 8.7% | 8,624 | 6,629 | 30.1% |
| #28.1 | Subaru Impreza * | 57,996 | 58,856 | -1.5% | 5,808 | 4,949 | 17.4% |
| #28.2 | Subaru Impreza WRX/STi * | 25,492 | 17,969 | 41.9% | 2,816 | 1,680 | 67.6% |
| #29 | Ford Mustang | 82,635 | 77,186 | 7.1% | 9,511 | 5,727 | 66.1% |
| #30 | Mercedes-Benz C-Class | 75,065 | 88,251 | -14.9% | 8,224 | 7,229 | 13.8% |
| #31 | Lexus ES | 72,508 | 72,581 | -0.1% | 7,782 | 8,213 | -5.2% |
| #32 | Subaru XV Crosstrek | 70,956 | 53,741 | 32.0% | 5,482 | 5,525 | -0.8% |
| #33 | Kia Forte | 69,336 | 66,146 | 4.8% | 5,306 | 4,302 | 23.3% |
| #34 | Toyota Avalon | 67,183 | 70,990 | -5.4% | 6,501 | 6,212 | 4.7% |
| #35 | Mercedes-Benz E-Class | 66,400 | 69,803 | -4.9% | 5,119 | 8,727 | -41.3% |
| #36 | Hyundai Accent | 63,309 | 60,458 | 4.7% | 8,566 | 7,100 | 20.6% |
| #37 | Ford Fiesta | 63,192 | 71,073 | -11.1% | 3,724 | 4,476 | -16.8% |
| #38 | Ford Taurus | 62,629 | 79,960 | -21.7% | 3,748 | 5,411 | -30.7% |
| #38.1 | Ford Taurus * | 52,395 | 69,063 | -24.1% | 3,061 | 4,696 | -34.8% |
| #38.2 | Ford Taurus Poice Interceptor * | 10,234 | 10,897 | -6.1% | 687 | 715 | -3.9% |
| #39 | Honda Fit | 59,340 | 53,513 | 10.9% | 6,450 | 4,617 | 39.7% |
| #40 | Chrysler 300 | 53,382 | 57,724 | -7.5% | 3,992 | 4,881 | -18.2% |
| #41 | Mazda 6 | 53,224 | 43,637 | 22.0% | 4,323 | 4,365 | -1.0% |
| #42 | BMW 5-Series | 52,704 | 56,863 | -7.3% | 5,517 | 8,102 | -31.9% |
| #43 | Subaru Legacy | 52,270 | 42,291 | 23.6% | 5,457 | 2,939 | 85.7% |
| #44 | Dodge Avenger | 51,705 | 93,842 | -44.9% | 455 | 4,950 | -90.8% |
| #45 | Dodge Challenger | 51,611 | 51,462 | 0.3% | 4,938 | 2,872 | 71.9% |
| #46 | Buick LaCrosse | 51,468 | 48,798 | 5.5% | 5,034 | 3,123 | 61.2% |
| #47 | Lexus IS | 51,358 | 35,017 | 46.7% | 5,939 | 5,414 | 9.7% |
| #48 | Nissan Maxima | 50,401 | 53,896 | -6.5% | 3,180 | 6,509 | -51.1% |
| #49 | Buick Verano | 43,743 | 45,527 | -3.9% | 3,017 | 2,929 | 3.0% |
| #50 | Toyota Prius C ² | 40,570 | 41,979 | -3.4% | 2,839 | 2,810 | 1.0% |
| #51 | Chevrolet Spark | 39,159 | 34,130 | 14.7% | 3,007 | 1,712 | 75.6% |
| #52 | Audi A4 | 38,679 | 42,130 | -8.2% | 3,599 | 3,979 | -9.6% |
| #52.1 | Audi A4 Sedan/Avant * | 33,993 | 36,744 | -7.5% | 3,197 | 3,543 | -9.8% |
| #52.2 | Audi A4 Allroad * | 4,686 | 5,386 | -13.0% | 402 | 436 | -7.8% |
| #53 | Infiniti Q50 | 36,899 | 17,816 | 107% | 3,855 | 4,568 | -15.6% |
| #54 | Kia Rio | 35,933 | 40,742 | -11.8% | 1,924 | 2,156 | -10.8% |
| #55 | Chevrolet Corvette | 34,839 | 17,291 | 101% | 3,552 | 3,005 | 18.2% |
| #56 | Lincoln MKZ | 34,009 | 32,361 | 5.1% | 2,636 | 2,823 | -6.6% |
| #57 | Fiat 500 | 33,708 | 35,834 | -5.9% | 2,302 | 2,324 | -0.9% |
| #58 | Volkswagen Golf | 33,675 | 30,931 | 8.9% | 4,405 | 1,852 | 138% |
| #58.1 | Volkswagen Golf GTI * | 17,362 | 13,310 | 30.4% | 1,789 | 976 | 83.3% |
| #58.2 | Volkswagen Golf * | 15,941 | 16,023 | -0.5% | 2,379 | 854 | 179% |
| #58.3 | Volkswagen e-Golf * | 357 | --- | --- | 237 | --- | --- |
| #58.4 | Volkswagen Golf R * | 15 | 1,598 | -99.1% | --- | 22 | -100% |
| #59 | Mini Cooper | 31,385 | 41,915 | -25.2% | 4,545 | 3,887 | 16.9% |
| #59.1 | Mini Cooper Hardtop * | 22,843 | 26,954 | -15.3% | 4,176 | 2,995 | 39.4% |
| #59.2 | Mini Cooper Convertible | 3,536 | 4,460 | -20.7% | 219 | 262 | -16.4% |
| #59.3 | Mini Cooper Clubman * | 2,613 | 5,155 | -49.3% | 4 | 379 | -98.9% |
| #59.4 | Mini Cooper Roadster * | 1,437 | 2,806 | -48.8% | 95 | 134 | -29.1% |
| #59.5 | Mini Cooper Coupe * | 956 | 2,540 | -62.4% | 51 | 117 | -56.4% |
| #60 | Cadillac CTS | 31,115 | 32,343 | -3.8% | 2,652 | 3,217 | -17.6% |
| #61 | Toyota Prius V ² | 30,762 | 34,989 | -12.1% | 2,284 | 2,110 | 8.2% |
| #62 | Nissan Leaf | 30,200 | 22,610 | 33.6% | 3,102 | 2,529 | 22.7% |
| #63 | Hyundai Genesis ³ | 29,992 | 32,330 | -7.2% | 2,923 | 3,280 | -10.9% |
| #64 | Toyota Venza | 29,991 | 35,846 | -16.3% | 2,419 | 2,148 | 12.6% |
| #65 | Cadillac ATS | 29,890 | 38,319 | -22.0% | 2,465 | 3,887 | -36.6% |
| #66 | Volkswagen Beetle | 29,182 | 43,134 | -32.3% | 2,270 | 2,819 | -19.5% |
| #66.1 | Volkswagen Beetle Coupe * | 17,414 | 25,084 | -30.6% | 1,600 | 1,856 | -13.8% |
| #66.2 | Volkswagen Beetle Convertible * | 11,768 | 18,050 | -34.8% | 670 | 963 | -30.4% |
| #67 | Hyundai Veloster | 27,598 | 30,711 | -10.1% | 1,685 | 3,047 | -44.7% |
| #68 | Ford C-Max | 27,595 | 35,210 | -21.6% | 1,962 | 2,028 | -3.3% |
| #69 | Mercedes-Benz CLA-Class | 27,365 | 14,113 | 93.9% | 2,664 | 3,285 | -18.9% |
| #70 | Mercedes-Benz S-Class | 25,276 | 13,303 | 90.0% | 2,832 | 1,857 | 52.5% |
| #71 | Cadillac XTS | 24,335 | 32,559 | -25.3% | 2,276 | 2,670 | -14.8% |
| #72 | Audi A6 | 23,941 | 22,428 | 6.7% | 2,945 | 2,686 | 9.6% |
| #73 | Buick Regal | 22,560 | 18,685 | 20.7% | 1,811 | 1,747 | 3.7% |
| #74 | Audi A3 | 22,250 | 857 | 2,496% | 2,690 | - | - |
| #75 | Lexus GS | 22,198 | 19,742 | 12.4% | 2,745 | 2,604 | 5.4% |
| #76 | Volvo S60 | 20,457 | 23,210 | -11.9% | 1,866 | 1,776 | 5.1% |
| #77 | Acura TLX | 19,127 | - | - | 3,834 | - | - |
| #78 | Chevrolet Volt | 18,805 | 23,094 | -18.6% | 1,490 | 2,392 | -37.7% |
| #79 | Scion tC | 17,947 | 19,094 | -6.0% | 1,128 | 1,143 | -1.3% |
| #80 | Acura ILX | 17,854 | 20,430 | -12.6% | 1,730 | 1,573 | 10.0% |
| #81 | Lexus CT200h | 17,673 | 15,071 | 17.3% | 1,608 | 1,787 | -10.0% |
| #82 | Mitsubishi Mirage | 16,708 | 2,935 | 469% | 1,135 | 1,388 | -18.2% |
| #83 | Audi A5 | 16,620 | 18,664 | -11.0% | 1,292 | 1,384 | -6.6% |
| #84 | Scion xB | 16,583 | 17,849 | -7.1% | 1,480 | 1,288 | 14.9% |
| #85 | Mitsubishi Lancer | 16,495 | 19,451 | -15.2% | 1,547 | 1,362 | 13.6% |
| #86 | Infiniti Q40/G Sedan | 15,590 | 30,256 | -48.5% | 1,184 | 1,460 | -18.9% |
| #87 | Scion FR-S | 14,062 | 18,327 | -23.3% | 834 | 1,029 | -19.0% |
| #88 | Mazda 2 | 13,615 | 11,757 | 15.8% | 159 | 1,228 | -87.1% |
| #89 | Toyota Yaris | 13,274 | 21,342 | -37.8% | 1,605 | 601 | 167% |
| #90 | Fiat 500L | 12,413 | 7,402 | 67.7% | 1,482 | 1,421 | 4.3% |
| #91 | Honda Crosstour | 11,802 | 16,847 | -29.9% | 863 | 1,360 | -36.5% |
| #92 | Acura TL | 10,616 | 24,318 | -56.3% | 76 | 1,795 | -95.8% |
| #93 | Smart Fortwo | 10,453 | 9,264 | 12.8% | 973 | 855 | 13.8% |
| #94 | Porsche 911 | 10,433 | 10,442 | -0.1% | 776 | 828 | -6.3% |
| #95 | Volkswagen CC | 9,995 | 15,672 | -36.2% | 623 | 909 | -31.5% |
| #96 | BMW 7-Series | 9,744 | 10,932 | -10.9% | 1,096 | 1,119 | -2.1% |
| #97 | Kia Cadenza | 9,267 | 8,626 | 7.4% | 548 | 844 | -35.1% |
| #98 | BMW 6-Series | 8,647 | 9,762 | -11.4% | 624 | 1,078 | -42.1% |
| #99 | Lexus LS | 8,559 | 10,727 | -20.2% | 1,020 | 1,064 | -4.1% |
| #100 | Lincoln MKS | 8,160 | 10,793 | -24.4% | 927 | 1,074 | -13.7% |
| #101 | Audi A7 | 8,133 | 8,483 | -4.1% | 524 | 944 | -44.5% |
| #102 | Infiniti Q60 | 7,740 | 9,806 | -21.1% | 658 | 462 | 42.4% |
| #103 | Subaru BRZ | 7,504 | 8,587 | -12.6% | 416 | 705 | -41.0% |
| #104 | Scion xD | 7,377 | 9,005 | -18.1% | 288 | 662 | -56.5% |
| #105 | BMW 1-Series & 2-Series ³ | 7,345 | 7,220 | 1.7% | 724 | 1,039 | -30.3% |
| #106 | Hyundai Azera | 7,232 | 11,221 | -35.5% | 697 | 1,092 | -36.2% |
| #107 | Nissan 370Z | 7,199 | 6,561 | 9.7% | 446 | 469 | -4.9% |
| #108 | Mercedes-Benz CLS-Class | 6,981 | 8,032 | -13.1% | 575 | 710 | -19.0% |
| #109 | Acura TSX | 6,287 | 17,484 | -64.0% | 17 | 1,019 | -98.3% |
| #109.1 | Acura TSX Sedan * | 5,647 | 15,508 | -63.6% | 14 | 911 | -98.5% |
| #109.2 | Acura TSX SportWagon * | 640 | 1,976 | -67.6% | 3 | 108 | -97.2% |
| #110 | BMW i3 | 6,092 | - | - | 1,013 | - | - |
| #111 | Audi A8 | 5,904 | 6,300 | -6.3% | 732 | 718 | 2.0% |
| #112 | Jaguar XF | 5,880 | 7,922 | -25.8% | 772 | 805 | -4.1% |
| #113 | Porsche Panamera | 5,740 | 5,421 | 5.9% | 320 | 500 | -36.0% |
| #114 | Volvo XC70 | 5,093 | 4,882 | 4.3% | 470 | 445 | 5.6% |
| #115 | Infiniti Q70/M | 5,034 | 5,283 | -4.7% | 656 | 367 | 78.7% |
| #116 | Mercedes-Benz SL-Class | 5,030 | 7,007 | -28.2% | 539 | 565 | -4.6% |
| #117 | Volvo V60 | 4,990 | 0.0% | 357 | 0.0% | ||
| #118 | Mazda MX-5 Miata | 4,745 | 5,780 | -17.9% | 378 | 276 | 37.0% |
| #119 | Mercedes-Benz SLK-Class | 4,737 | 4,757 | -0.4% | 384 | 393 | -2.3% |
| #120 | Jaguar XJ | 4,329 | 5,434 | -20.3% | 375 | 449 | -16.5% |
| #121 | Jaguar F-Type | 4,112 | 2,250 | 82.8% | 448 | 185 | 142% |
| #122 | Honda Insight | 3,965 | 4,802 | -17.4% | 311 | 418 | -25.6% |
| #123 | Porsche Boxster | 3,875 | 4,570 | -15.2% | 144 | 262 | -45.0% |
| #124 | Nissan Cube | 3,785 | 5,461 | -30.7% | 186 | 432 | -56.9% |
| #125 | Chevrolet Caprice PPV | 3,727 | 3,899 | -4.4% | 288 | 412 | -30.1% |
| #126 | Honda CR-Z | 3,562 | 4,550 | -21.7% | 224 | 384 | -41.7% |
| #127 | Porsche Cayman | 3,417 | 3,383 | 1.0% | 198 | 277 | -28.5% |
| #128 | Hyundai Equus | 3,415 | 3,578 | -4.6% | 343 | 352 | -2.6% |
| #129 | Acura RLX/RL ³ | 3,413 | 5,053 | -32.5% | 233 | 597 | -61.0% |
| #130 | Volkswagen Eos | 3,411 | 4,178 | -18.4% | 204 | 222 | -8.1% |
| #131 | Chevrolet SS | 2,479 | 418 | 493% | 93 | 239 | -61.1% |
| #132 | BMW Z4 | 2,151 | 2,480 | -13.3% | 168 | 191 | -12.0% |
| #133 | Scion iQ | 2,040 | 4,046 | -49.6% | 87 | 201 | -56.7% |
| #134 | Lexus RC | 1,922 | - | - | 1,042 | - | - |
| #135 | Volvo S80 | 1,753 | 1,935 | -9.4% | 79 | 186 | -57.5% |
| #136 | Jaguar XK | 1,452 | 1,346 | 7.9% | 88 | 105 | -16.2% |
| #137 | Nissan GT-R | 1,436 | 1,236 | 16.2% | 156 | 78 | 100% |
| #138 | Kia K900 | 1,330 | - | - | 93 | - | - |
| #139 | Cadillac ELR | 1,310 | 6 | 21,733% | 118 | 6 | 1,867% |
| #140 | Audi TT | 1,158 | 2,053 | -43.6% | 12 | 159 | -92.5% |
| #141 | Volvo C70 | 779 | 3,234 | -75.9% | 1 | 195 | -99.5% |
| #142 | Mercedes-Benz B-Class | 776 | 20 | 3,780% | 326 | 2 | 16,200% |
| #143 | Dodge Viper | 760 | 591 | 28.6% | 89 | 55 | 61.8% |
| #144 | Audi R8 | 735 | 813 | -9.6% | 64 | 70 | -8.6% |
| #145 | BMW i8 | 555 | - | - | 158 | - | - |
| #146 | Mercedes-Benz SLS AMG | 232 | 451 | -48.6% | 6 | 44 | -86.4% |
| #147 | Mercedes-Benz CL-Class | 221 | 476 | -53.6% | 14 | 45 | -68.9% |
| #148 | Mitsubishi i-MiEV | 196 | 1,029 | -81.0% | 12 | 11 | 9.1% |
| #149 | Mitsubishi Galant | 122 | 1,441 | -91.5% | - | 15 | -100% |
| #150 | Porsche 918 Spyder | 96 | - | - | 39 | - | - |
| #151 | Alfa Romeo 4C | 91 | - | - | 67 | - | - |
| #152 | Volvo C30 | 66 | 1,361 | -95.2% | - | 17 | -100% |
| #153 | Lexus LFA | 17 | 23 | -26.1% | 1 | 1 | 0.0% |
| #154 | Mercedes-Benz R-Class | 8 | 30 | -73.3% | 1 | - | - |
| #155 | Mercedes-Benz CLK-Class | 3 | - | - | - | - | - |
| #156 | Honda FCX | 2 | 10 | -80.0% | 1 | 4 | -75.0% |
| #157 | Mazda RX-8 | 1 | 1 | 0.0% | - | - | - |
| #159 | Suzuki Kizashi | - | 1,602 | -100% | - | - | - |
| #160 | Mitsubishi Eclipse | - | 109 | -100% | - | - | - |
| #161 | Dodge Caliber | - | 45 | -100% | - | - | - |
| #162 | Cadillac DTS | - | 19 | -100% | - | - | - |
| #163 | Buick Lucerne | - | 9 | -100% | - | - | - |
| #164 | Cadillac STS | - | 7 | -100% | - | - | - |
| #165 | Lexus HS | - | 5 | -100% | - | - | - |
| #166 | Chevrolet HHR | - | 3 | -100% | - | - | - |
| #167 | Chevrolet Aveo | - | 2 | -100% | - | - | - |
| #168 | Honda S2000 | - | 2 | -100% | - | - | - |
--- | Total | 7,935,161 | 7,801,870 | 1.7% | 679,303 | 632,957 | 7.3% |
--- | --- | --- | --- | --- | --- | --- | --- |
* Italicized, asterisked, unranked lines are nothing more than available breakdowns, already included in the models total, not in addition to the models total.
² Total Prius Family sales: down 11.5% to 207,372 in 2014; down 8.3% to 14,414 in December.
³ BMW has chosen to include sales of the 4-Series within figures for the 3-Series, presumably for year-over-year consistencys sake, while also combining the 1-Series and 2-Series. Hyundai does the same with the Genesis and Genesis Coupe. Likewise, Acura has chosen to combine sales figures for the RLX and its predecessor, the RL.
Sales data for brands such as Aston Martin, Ferrari, Lamborghini, Lotus, Rolls-Royce etc. are unfortunately not broken down by model. ANDC estimates say sales for those brands in 2014 were 1224, 2100, 708, 172, and 900, respectively. Tesla, unfortunately, doesnt release model-specific monthly U.S. sales data, but Automotive News now issues estimates for the brand, and those estimates say Tesla sold 2200 cars in December; 26,400 in 2014. HybridCars.com, however, has typically estimated much lower Model S sales, 1900 in December; 16,550 in 2014.
Subscribe to:
Posts (Atom)