Showing posts with label in. Show all posts
Showing posts with label in. Show all posts
Sunday, March 29, 2015
2012 Bugatti Veyron Car Fastest And Most Expensive In The World
One of fastest cars on the market (production models, as opposed to concept cars), measured by high-speed testing (theoretical speed does not count).

Bugatti Veyron Super Sports $2,400,000. This is by far the most expensive street legal car available on the market today (the base Veyron costs $1,700,000). It is the fastest accelerating car reaching 0-60 in 2.5 seconds. It is also the fastest street legal car when tested again on July 10, 2010 with the 2010 Super Sport Version reaching a top speed of 267 mph. When competing against the Bugatti Veyron, you better be prepared!
The 16-cylinder “W” configuration engine is fed by four turbochargers and features 64 valves, generating 1001 horsepower at 6000 rpm. The engine draws on its 8-litre displacement to deliver a maximum torque of 1250 Newton-metres between 2200 and 5500 rpm. With full-time all-wheel drive, the car’s phenomenal power produces breath-takingly dynamic handling, with acceleration from 0 to 100 km/h in a mere 2.5 seconds. The Bugatti Veyron 16.4 benefits from aeronautical and aerospace technologies, making it the fastest production car ever made. The car also features a braking system designed to deliver unprecedented powers of deceleration, establishing a new industry benchmark. The carbon-fibre discs provide brake pressure of up to 180 bars, combined with eight-piston monobloc callipers and titanium pistons fitted with fine steel heads and ceramic heat protectors. Apply the brakes at speeds above 200 km/h, and the rear wing acts as an airbrake, positioning itself at an angle of 113 degrees in less than 0.4 seconds, augmenting the Bugatti Veyron’s already impressive stopping power. The airbrake increases negative lift at the rear of the car to 300 kg, enhancing the braking torque on the rear axle. At 400 km/h, emergency braking will bring the sports car to a complete halt in less than 10 seconds.


Saturday, March 28, 2015
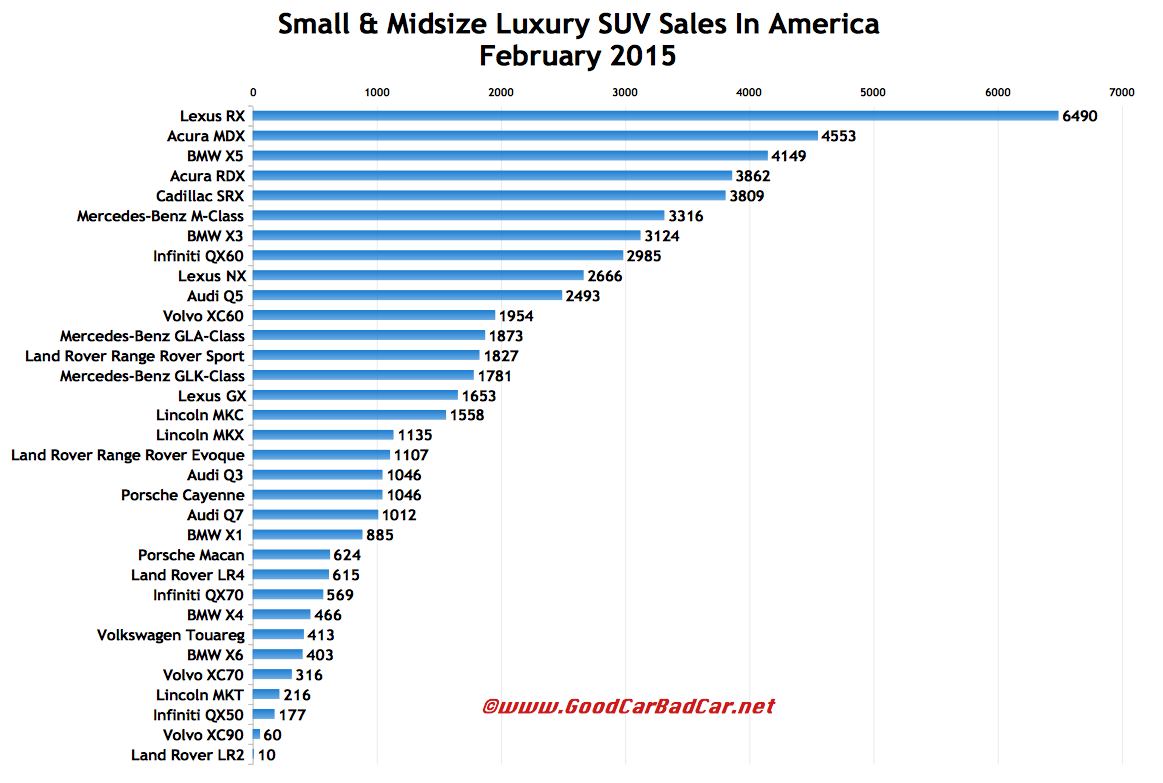
Small And Midsize Luxury SUV Sales In America February 2015 YTD

• U.S. Vehicle Sales Rankings By Model - February 2015 YTD
• U.S. SUV/Crossover Sales Rankings By Model - February 2015 YTD
 |
| Click Chart To Expand |
A number of more costly, mostly larger luxury SUVs and crossovers posted February gains, as well. From the BMW X5s 42% jump to the Land Rover Range Rover Sports 25% ascent, theres reason to believe that luxury SUVs dont need to be small (or large) to expand their market share.
But the rate of expansion in the premium arena is most easily located in a look at entry-level crossovers, particularly when we consider the age of some of the entries. Mercedes-Benzs GLK and the Audi Q5 have been around since 2009 and the second-gen BMW X3 is now operating in its fifth model year.
You can click any model name in the tables below to find historical monthly and yearly U.S. auto sales data. You can also select a make and model at GCBCs Sales Stats page. These tables are now sortable, so you can rank luxury SUVs and crossovers any which way you like. Suggestions on how GCBC should break down segments can be passed on through the Contact page.
Click Column Headers To Sort • January 2015 • February 2014
Compact Luxury SUV | February 2015 | February 2014 | % Change | 2015 YTD | 2014 YTD | % Change |
|---|---|---|---|---|---|---|
Audi Q3 | 1046 | --- | --- | 1919 | --- | --- |
BMW X1 | 885 | 2329 | -62.0% | 1403 | 3661 | -61.7% |
Mercedes-Benz GLA-Class | 1873 | --- | --- | 3751 | --- | --- |
--- | --- | --- | --- | --- | --- | --- |
Total | 3804 | 2329 | 63.3% | 7073 | 3661 | 93.2% |
Small Luxury SUV | February 2015 | February 2014 | % Change | 2015 YTD | 2014 YTD | % Change |
|---|---|---|---|---|---|---|
Acura RDX | 3862 | 2911 | 32.7% | 7379 | 5641 | 30.8% |
Audi Q5 | 2493 | 2643 | -5.7% | 5420 | 5417 | 0.1% |
BMW X3 | 3124 | 3301 | -5.4% | 4465 | 6000 | -25.6% |
BMW X4 | 466 | -- | --- | 862 | --- | --- |
Infiniti QX50 | 177 | 220 | -19.5% | 365 | 417 | -12.5% |
Land Rover LR2 | 10 | 358 | -97.2% | 46 | 721 | -93.6% |
Land Rover Range Rover Evoque | 1107 | 927 | 19.4% | 2510 | 1806 | 39.0% |
Lexus NX | 2666 | --- | --- | 5478 | --- | --- |
Lincoln MKC | 1558 | --- | --- | 3160 | --- | -- |
Mercedes-Benz GLK-Class | 1781 | 2624 | -32.1% | 3179 | 4926 | -35.5% |
Porsche Macan | 624 | --- | --- | 1420 | --- | --- |
Volvo XC60 | 1954 | 1146 | 70.5% | 3471 | 2088 | 66.2% |
--- | --- | --- | --- | --- | --- | --- |
Total | 19,822 | 14,130 | 40.3% | 37,755 | 27,016 | 39.7% |
Midsize Luxury SUV | February 2015 | February 2014 | % Change | 2015 YTD | 2014 YTD | % Change |
|---|---|---|---|---|---|---|
Acura MDX | 4553 | 4563 | -0.2% | 8934 | 8804 | 1.5% |
Acura ZDX | --- | 8 | -100% | --- | 22 | -100% |
Audi Q7 | 1012 | 1229 | -17.7% | 1892 | 2497 | -24.2% |
BMW X5 | 4149 | 2912 | 42.5% | 7363 | 5666 | 30.0% |
BMW X6 | 403 | 346 | 16.5% | 836 | 728 | 14.8% |
Cadillac SRX | 3809 | 5058 | -24.7% | 7294 | 9504 | -23.3% |
Infiniti QX60 | 2985 | 2704 | 10.4% | 5562 | 5084 | 9.4% |
Infiniti QX70 | 569 | 624 | -8.8% | 1126 | 1269 | -11.3% |
Land Rover LR4 | 615 | 388 | 58.5% | 1224 | 987 | 24.0% |
Land Rover Range Rover Sport | 1827 | 1464 | 24.8% | 3579 | 3076 | 16.4% |
Lexus GX460 | 1653 | 1590 | 4.0% | 3456 | 3033 | 13.9% |
Lexus RX | 6490 | 5682 | 14.2% | 13,059 | 11,289 | 15.7% |
Lincoln MKT | 216 | 365 | -40.8% | 484 | 727 | -33.4% |
Lincoln MKX | 1135 | 2041 | -44.4% | 2493 | 4520 | -44.8% |
Mercedes-Benz M-Class | 3316 | 3258 | 1.8% | 6460 | 6082 | 6.2% |
Porsche Cayenne | 1046 | 1260 | -17.0% | 2162 | 2418 | -10.6% |
Volkswagen Touareg * | 413 | 448 | -7.8% | 895 | 992 | -9.8% |
Volvo XC70 * | 316 | 267 | 18.4% | 646 | 528 | 22.3% |
Volvo XC90 | 60 | 420 | -85.7% | 98 | 879 | -88.9% |
--- | --- | --- | --- | --- | --- | --- |
Total | 34,567 | 34,627 | -0.2% | 67,563 | 68,105 | -0.8% |
* indicates a vehicle which is also shown in another GCBC segment breakdown
GCBC isnt here to break down segments, an impossible task for any group, but to display sales data for the sake of comparison. The more ways sales data can be displayed, the better. This explains youll see the XC70 listed with luxury cars as well as with SUVs and crossovers and the Touareg with luxury SUVs and mainstream SUVs... because readers have wanted it both ways. You can always find the sales results for EVERY vehicle and form your own competitive sets by using the All Vehicle Rankings posts.
RECOMMENDED READING
Small & Midsize Luxury SUV Sales In America - January 2015
Small & Midsize Luxury SUV Sales In America - February 2014 YTD
Top 20 Best-Selling SUVs In America - February 2015
U.S. Auto Sales Brand Rankings - February 2015 YTD
Large Luxury SUV Sales In America - February 2015 YTD
Top 20 Best Selling Cars In America September 2014
• All Makes & Models Ranked By September 2014 YTD U.S. Sales
• U.S. Car Sales Rankings By Model - September 2014 YTD
Accord sales jumped 31% last month; Camry sales slid 11%. The next-best-selling Honda Civic was down 3%. The sixth, seventh, ninth, 17th, 19th, and 20th-best-selling cars in America all reported declining year-over-year sales in September, as well, and this in a market which shot up 9.4% to more than 1.25 million units.
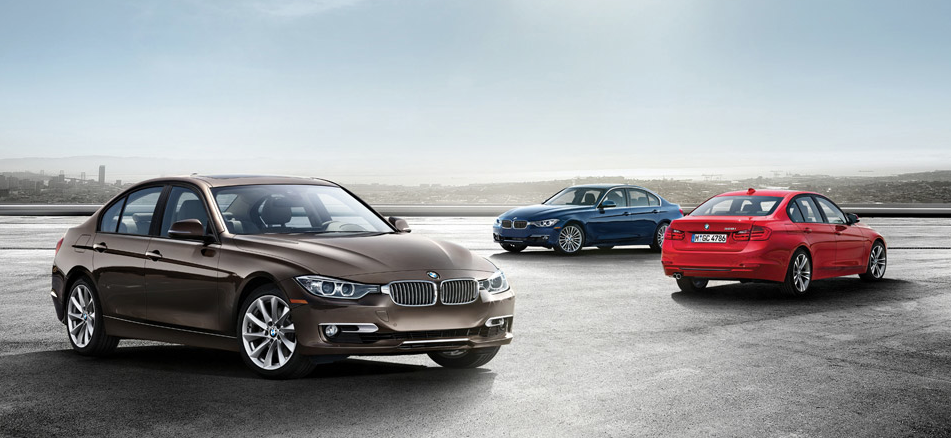
In addition to the Accords big jump, sales of the Chevrolet Cruze, Nissan Sentra, Nissan Versa, Subaru Outback, and Kia Soul all climbed far beyond their September 2013 tallies. Likewise, the BMW 3-Series (sales figures for which include the 4-Series in the U.S.) were half again as strong as they were a year ago. No premium brand car came close to selling as often as the BMW duo, with its wide-spread range encompassing a pair of hatchbacks, a sedan, a coupe, a convertible, and a wagon.
Historical monthly and yearly sales figures for any of these best-selling cars can always be accessed through the dropdown menu at GCBCs Sales Stats page, and for those not viewing the mobile version of this site, near the top right of this page, as well. GoodCarBadCar has already published the list of Americas best-selling trucks and will shortly publish the list of Americas best-selling SUVs in September 2014.
October 2014 • August 2014 • September 2013
Rank | Best-Selling Car | September 2014 | September 2013 | % Change | 2014 YTD | 2013 YTD | % Change |
#1 | Honda Accord | 32,956 | 25,176 | 30.9% | 304,382 | 282,102 | 7.9% |
#2 | Toyota Camry | 28,507 | 31,871 | -10.6% | 334,978 | 318,990 | 5.0% |
#3 | Honda Civic | 22,263 | 22,983 | -3.1% | 253,430 | 253,561 | -0.1% |
#4 | Ford Fusion | 21,693 | 19,972 | 8.6% | 240,585 | 226,293 | 6.3% |
#5 | Nissan Altima | 21,675 | 21,221 | 2.1% | 256,935 | 249,518 | 3.0% |
#6 | Toyota Corolla/Matrix | 20,530 | 23,251 | -11.7% | 258,805 | 233,547 | 10.8% |
#7 | Hyundai Elantra | 18,848 | 19,691 | -4.3% | 176,403 | 194,593 | -9.3% |
#8 | Chevrolet Cruze | 18,415 | 12,730 | 44.7% | 208,114 | 195,775 | 6.3% |
#9 | Ford Focus | 15,397 | 16,733 | -8.0% | 176,156 | 188,654 | -6.6% |
#10 | Chevrolet Malibu | 15,186 | 14,487 | 4.8% | 148,574 | 154,950 | -4.1% |
#11 | Hyundai Sonata | 14,918 | 13,872 | 7.5% | 164,934 | 152,702 | 8.0% |
#12 | BMW 3-Series/4-Series * | 12,814 | 8512 | 50.5% | 94,445 | 77,921 | 21.2% |
#13 | Nissan Sentra | 12,557 | 7798 | 61.0% | 141,216 | 98,281 | 43.7% |
#14 | Nissan Versa | 12,072 | 8776 | 37.6% | 110,272 | 91,535 | 20.5% |
#15 | Subaru Outback ^ | 11,315 | 8143 | 39.0% | 97,266 | 90,073 | 8.0% |
#16 | Chrysler 200 | 10,995 | 9583 | 14.7% | 75,142 | 102,859 | -26.9% |
#17 | Kia Optima | 10,908 | 11,647 | -6.3% | 122,646 | 124,056 | -1.1% |
#18 | Kia Soul | 10,802 | 7416 | 45.7% | 115,579 | 90,624 | 27.5% |
#19 | Volkswagen Jetta | 10,245 | 13,309 | -23.0% | 115,055 | 124,273 | -7.4% |
#20 | Chevrolet Impala | 9225 | 11,462 | -19.5% | 107,162 | 121,033 | -11.5% |
* BMW USA, not GoodCarBadCar, chooses to combined sales of the 3-Series and 4-Series.
^GCBC will be displaying the Outback with cars until at least the end of the year. As an SUV/crossover, it would have ranked 11th in September.
RECOMMENDED READING
Top 20 Best-Selling Cars In America - October 2014
Top 20 Best-Selling Cars In America - August 2014
Top 20 Best-Selling Cars In America - September 2013
U.S. Auto Sales Brand Rankings - September 2014 YTD
Top 13 Best-Selling Trucks In America - September 2014 YTD
Top 20 Best-Selling SUVs In America - September 2014
Midsize Car Sales In Canada June 2014 YTD

• Canada Auto Sales Brand Rankings - June 2014 YTD
• Canada Vehicle Sales Rankings By Model - June 2014 YTD
• Canada Car Sales Rankings By Model - June 2014 YTD
 |
| Click Chart To Expand |
At this stage one year ago, the Fusion was 2096 sales ahead of the second-ranked Toyota Camry.
But Camry volume has tumbled 13% through the first half of 2014 in advance of the updated MY2015 Camrys arrival. And the second-ranked Accord is down 2% this year, struggling to match the 2013 pace that saw Accord sales rise to a five-year high.
The Fusions June increase was certainly not symbolic of an overall improvement in the midsize sector, however. The Chevrolet Malibu, Chrysler 200, and Hyundai Sonata all reported year-over-year declines of at least 20%, a combined loss of 1240 units from those three models alone. The Camry, Accord, and Nissan Altima were collectively down 11%, a 485-unit decrease.
Canadian Altima volume has increased in only four of the last 18 months. The overall Nissan brand, on the other hand, is one of Canadas fastest-growing marques.
You can click any model name in the tables below to find historical monthly and yearly Canadian auto sales data. You can also select a make and model at GCBCs Sales Stats page. These tables are now sortable, so you can rank midsize cars of all stripes any which way you like. Suggestions on how GCBC should break down segments can be passed on through the Contact page.
Click Column Headers To Sort • July 2014 • May 2014 • June 2013
Midsize Car | June 2014 | June 2013 | % Change | 2014 YTD | 2013 YTD | % Change |
|---|---|---|---|---|---|---|
Buick Regal | 51 | 61 | -16.4% | 345 | 408 | -15.4% |
Chevrolet Malibu | 327 | 422 | -22.5% | 2942 | 4313 | -31.8% |
Chrysler 200 | 1127 | 1521 | -25.9% | 4497 | 7202 | -37.6% |
Dodge Avenger | 33 | 1000 | -96.7% | 452 | 4907 | -90.8% |
Ford Fusion | 2373 | 2194 | 8.2% | 9777 | 11,304 | -13.5% |
Honda Accord | 1594 | 1656 | -3.7% | 8860 | 9022 | -1.8% |
Hyundai Sonata | 1142 | 1893 | -39.7% | 5257 | 8262 | -36.4% |
Kia Optima | 1249 | 792 | 57.7% | 4878 | 5145 | -5.2% |
Mazda 6 | 290 | 288 | 0.7% | 1605 | 2743 | -41.5% |
Nissan Altima | 981 | 1131 | -13.3% | 4484 | 5313 | -15.6% |
Subaru Legacy | 150 | 132 | 13.6% | 1129 | 889 | 27.0% |
Suzuki Kizashi | --- | 16 | -100% | --- | 122 | -100% |
Toyota Camry | 1464 | 1737 | -15.7% | 8026 | 9208 | -12.8% |
Volkswagen Passat & CC ^ | 700 | 615 | 13.8% | 4062 | 3675 | 10.5% |
--- | --- | --- | --- | --- | --- | --- |
Total | 11,481 | 13,458 | -14.7% | 56,314 | 72,513 | -22.3% |
Hybrids & Electrics | June 2014 | June 2013 | % Change | 2014 YTD | 2013 YTD | % Change |
|---|---|---|---|---|---|---|
Chevrolet Volt | 163 | 153 | 6.5% | 831 | 471 | 76.4% |
Ford C-Max | 187 | 80 | 134% | 754 | 757 | -0.4% |
Honda Insight | --- | 10 | -100% | --- | 58 | -100% |
Mitsubishi i MiEV | 12 | 11 | 9.1% | 54 | 92 | -41.3% |
Nissan LEAF | 104 | 13 | 700% | 462 | 248 | 86.3% |
Toyota Prius | 168 | 255 | -34.1% | 986 | 1264 | -22.0% |
Toyota Prius Sedan ^ | 163 | 237 | -31.2% | 939 | 1116 | -15.9% |
Toyota Prius Plug-In ^ | 5 | 18 | -72.2% | 47 | 148 | -68.2% |
Toyota Prius V | 187 | 272 | -31.3% | 1151 | 1359 | -15.3% |
--- | --- | --- | --- | --- | --- | --- |
Total | 821 | 794 | 3.4% | 4238 | 4249 | -0.3% |
Tall Wagons & Crossovers | June 2014 | June 2013 | % Change | 2014 YTD | 2013 YTD | % Change |
|---|---|---|---|---|---|---|
Honda Crosstour * | 76 | 96 | -20.8% | 412 | 617 | -33.2% |
Subaru Outback * | 534 | 522 | 2.3% | 3342 | 2976 | 12.3% |
Toyota Venza * | 711 | 819 | -13.2% | 4078 | 4696 | -13.2% |
--- | --- | --- | --- | --- | --- | --- |
Total | 1321 | 1437 | -8.1% | 7832 | 8289 | -5.5% |
* indicates a vehicle that is also shown in another GCBC segment breakdown
^ Prius breakdown by variant
^ Volkswagen Canada combines figures for the Passat and CC.
GCBC isnt here to break down segments, an impossible task for any group, but to display sales data for the sake of comparison. The more ways sales data can be displayed, the better. This explains why youll see the Outback and Venza listed with midsize SUVs, too... because readers have wanted it both ways. You can always find the sales results for EVERY vehicle and form your own competitive sets by using the All Vehicle Rankings posts.
RECOMMENDED READING
Midsize Car Sales In Canada - July 2014 YTD
Midsize Car Sales In Canada - May 2014 YTD
Midsize Car Sales In Canada - June 2013 YTD
Top 20 Best-Selling Cars In Canada - June 2014
Large Car Sales In Canada - June 2014
Small Car Sales In Canada - June 2014 YTD
Subscribe to:
Posts (Atom)